
EARNINGS, VALUATIONS & MACRO CONTEXT

May 2026 | EPS Growth, Inflation Analog, Sector Rotation & Multiple Compression
The Fundamental Backdrop Behind the Positioning Extremes
This document examines the fundamental and macro data underpinning the current market. Unlike the sentiment and positioning analysis in Part 1, these charts address the question the market hasn’t answered yet: do the earnings and valuation numbers justify where prices are, and what does the inflation analog tell us about what comes next?
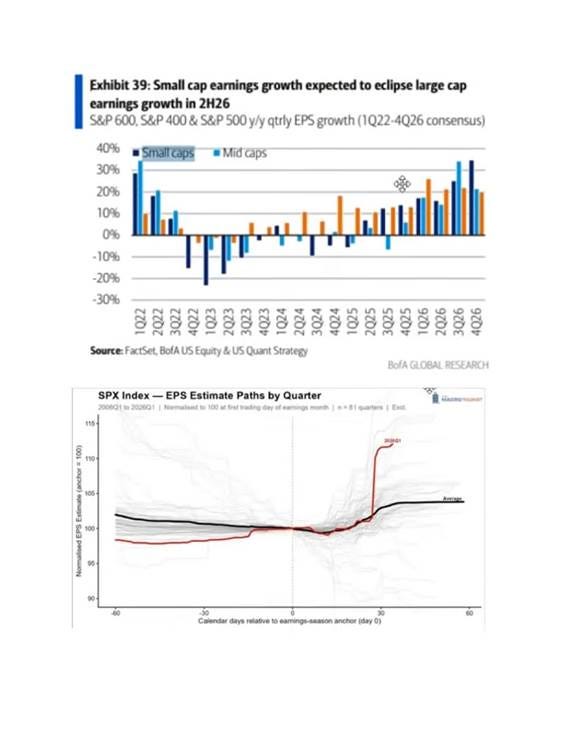
Small & Mid Cap Earnings Expected to Eclipse Large Cap in 2H26 + EPS Estimate Path Divergence
The BofA data (top chart) shows consensus expecting small cap (S&P 600) and mid cap (S&P 400) earnings growth to significantly outpace large cap (S&P 500) in 3Q and 4Q 2026 — with small caps projected to grow EPS at 30%+ year-over-year by 4Q26.
The Macro Tourist’s EPS estimate path chart (bottom) shows 2026Q1 earnings revisions tracking dramatically above the historical average across all 81 prior quarters in the dataset — the steepest positive revision path recorded since 2006.
BULLISH FUNDAMENTAL: 1Q26 earnings surprised by +9.2% — the strongest beat since 2021. Forward EPS revisions are running far above the historical average. The earnings cycle is accelerating, not deteriorating.
The small/mid cap rotation setup matters for portfolio construction. If large cap AI names begin to consolidate under the weight of the crowding and leverage data (Part 1), the rotation trade into small/mid cap earnings growth could be the next leg. This is a fundamentally driven opportunity, not a momentum chase.
ROTATION WATCH: Small caps are consensus-expected to grow EPS 30%+ y/y by 4Q26. If large cap tech digests, this is where the fundamental money moves. Watch the IWM/SPY ratio as the tell.
1Q26 Earnings Surprise Strongest Since 2021 + US Inflation: 1970s vs Today
The earnings surprise data (top) confirms the fundamental underpinning for May’s institutional rotation. A +9.2% aggregate beat in 1Q26, excluding one-time gains in GOOGL, META, and AMZN, is the strongest organic beat in 5 years. The market’s move has fundamental support, at least in the rear-view mirror.
The inflation overlay (bottom) is more complex and more dangerous. The Informationist’s chart maps current US CPI (2014–2030, left scale) against the 1966–1982 inflation cycle (right scale). April 2026 CPI at 3.78% tracks the analog’s 1970s pattern, specifically the period between the first and second inflation peaks.
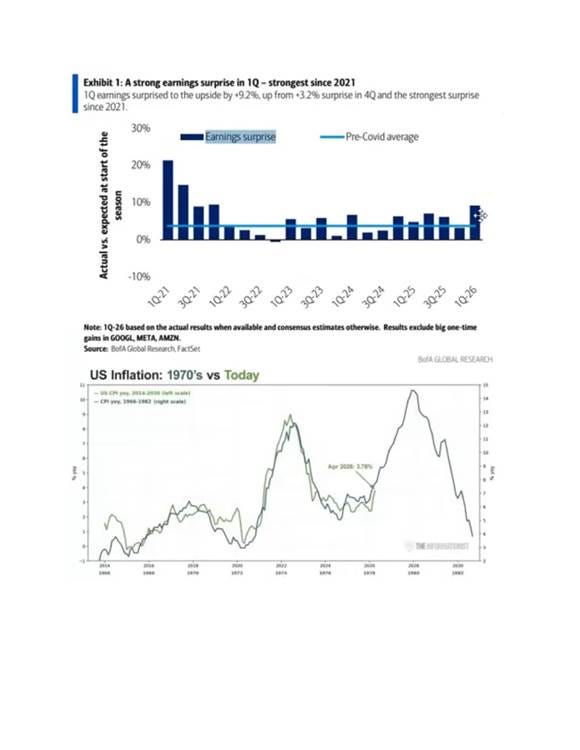
INFLATION ANALOG WARNING: The 1970s pattern showed inflation’s first peak (1970) was followed by a false resolution, then a far more destructive second peak (1974-75, then again 1980). April 2026 at 3.78% maps to the false-resolution phase. If the analog holds, inflation resurges.