


Inflation Nation
A Historical Perspective and Future Outlook

In 2022, I delivered a presentation discussing strategies the United States might employ to control its burgeoning national debt. It's no secret that governments often spend more than they collect. During times of war, the debt-to-GDP ratio typically climbs, and when compounded by events like the COVID-19 pandemic, which led to global shutdowns, the situation can deteriorate rapidly.
Our national debt-to-GDP ratio hit an all-time high of about 126% in 2020, surpassing the previous peak from 1946 of 120%; however, history shows us that post-World War II, this ratio was dramatically reduced. By 1970, it had fallen below 40%.

This begs the question: Did the government suddenly become frugal? Surprisingly, the answer is yes, to some extent. The government ran a budget surplus the years following 1946. (See chart below)

The following strategies played pivotal roles in bringing down debt to GDP:
Post-War Economic Strategies
After WWII, the U.S. experienced a few years of budget surplus, which was facilitated by:
Lowering Interest Rates: Refinancing existing debt at lower rates reduced the cost of servicing the debt.
Economic Growth: The post-war boom, driven by consumer demand, returning soldiers, the baby boom, and an expanding middle class, naturally decreased the debt-to-GDP ratio as GDP grew.
High Tax Rates: The era was marked by significantly high taxes on the wealthy and corporations, generating substantial government revenue.
Inflation Management: By allowing inflation to run high for several years, the real value of the debt was eroded, effectively reducing the debt burden in real terms.
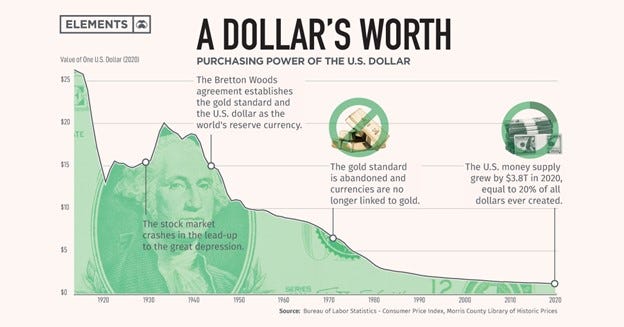
From my 2022 presentation titled "Inflation Nation," here's a slide illustrating how the value of the dollar depreciated over 2021 and 2022:

Inflation Rates Post-WWII
From 1941-1950, the average inflation rate was approximately 5.69%.
From 1946-1958, it averaged around 3.8%.
From 1941-1958, during this entire 18-year period the average inflation was 4.1%.

Over this 18-year period inflation went up 75.4%; imagine owing 100k and being able to pay back that 100k in 20 years with only 25k. This is always the goal of the government when debt to GDP gets above 100%: inflate away the debt! You can see what our government has done to the value of the dollar since the creation of the central bank in 1913. (See Image Below)
Modern Day Strategies
Today, with our debt-to-GDP ratio again over 100%, can we apply similar historical strategies?
Economic Growth: With advancements like AI, there's potential for significant growth, akin to post-WWII.
Budget Surplus: This is unlikely under current political leadership.
Lowering Rates: While rates might decrease, returning to the ultra-low rates of the 2010s is doubtful.
High Tax Rates: Political feasibility is low, though alternative revenue sources like tariffs might be explored.
Inflation: I predict inflation will be a key tool over the next decade, aiming to reduce the debt-to-GDP ratio, potentially averaging around the 4.1% seen post-1946.
Despite Federal Reserve Chair Powell’s public commitment to a 2% inflation target, the underlying strategy may involve tolerating higher inflation to manage national debt. The challenge for Powell lies in convincing the public that 2% is the goal, as transparency about higher anticipated inflation could exacerbate inflationary pressures.
Market Reactions and Investment Strategies
Recent Federal Reserve actions, like cutting rates by 50 basis points, have paradoxically led to rising yields due to market dynamics where investors shift funds from bonds to stocks, anticipating economic strength.

This situation mirrors the market behavior of 1995, suggesting a historical precedent for these movements.

During economic strength, many investors offload safer assets like bonds in favor of riskier options like stocks, raising bond yields due to decreased bond prices. This creates a counter-trend rally. Both 1995 and now exhibit mid-cycle cuts, where the Fed reduces interest rates amid economic expansion due to slowdown concerns.
In 1995 you had the same collapse in bonds and spike in yields after the first cut, but eventually yields went lower and bonds went higher.
Investment legends like Stanley Druckenmiller have begun shorting the U.S. bond market, indicating a belief that interest rates won’t drop as much as expected. He also warns that inflation may surge to levels not seen since the 1970s, with peaks hitting 11.3% and 13.5% in 1979 and 1980, respectively.
Paul Tudor Jones asserts, “All roads lead to inflation,” advocating for a portfolio that includes gold, Bitcoin, commodities, and technology stocks, while shunning fixed income.
Navigating the Investment Landscape
I recognized this inflationary strategy as early as 2022, prompting me to invest in hard assets, a trend I continue today. Stocks not only serve as a hedge against inflation but also as growth assets if inflation remains moderately high. In October 2023, I encouraged buying quality stocks and indices like QQQ and SPY, confident that we were nearing a market bottom and a market top on yields.

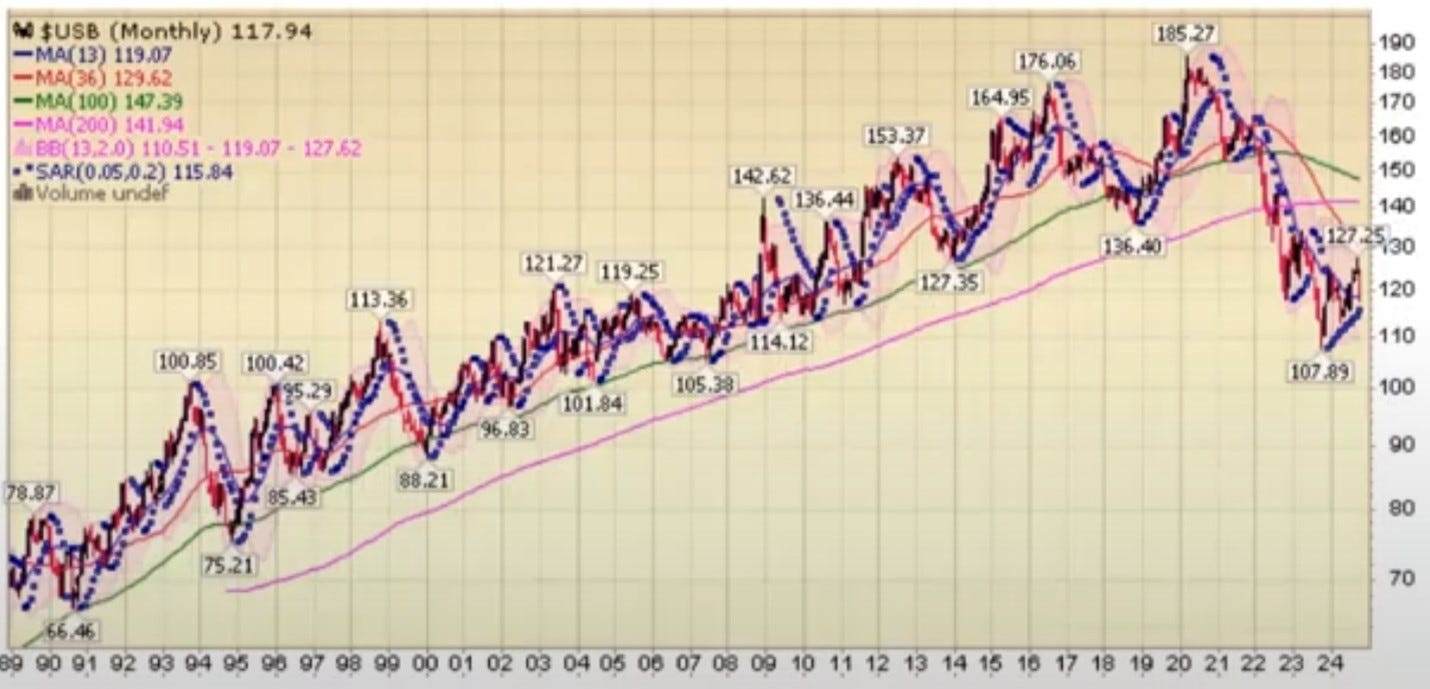
As yields peaked around 5% (see image above) we witnessed one of the strongest rallies, with SPY rising approximately 41% in just one year.

Notably, other stocks I invested in, such as META, AMD, NVDA, AMZN, GOOGL, and MSFT, performed even better.
A key indicator of the market's bottom was the Treasury Futures Call/Put skew, reflecting a market sentiment shift. As the Treasury market showed signs of improvement, I seized the opportunity, investing in companies undervalued during the panic. We put in a low in the long bonds last September and bonds have gone up ever since.

Conclusion
In these turbulent times, should we heed the wisdom of investment icons like Jones and Druckenmiller, or should we view market dips as buying opportunities? I believe a balanced approach is best. While it’s essential to protect ourselves in the short run—especially against rising inflation and market volatility—I also recognize the long-term value of investing in solid companies with strong earnings power and how this can protect me from inflation.
Unlike the October 2023 environment, I’m not solely focused on the “Magnificent Seven” companies for substantial growth. There are numerous undervalued opportunities among smaller and emerging companies as well as other markets.
I believe the other 493 can outperform the “Magnificent Seven” as well as emerging markets and small caps. In October 2023 I also bought names like PYPL, VFC, MMM, DIS, XBI and IWM.

While I have cashed in on a few of the companies I mentioned above, I still believe the IWM and XBI have room to run.
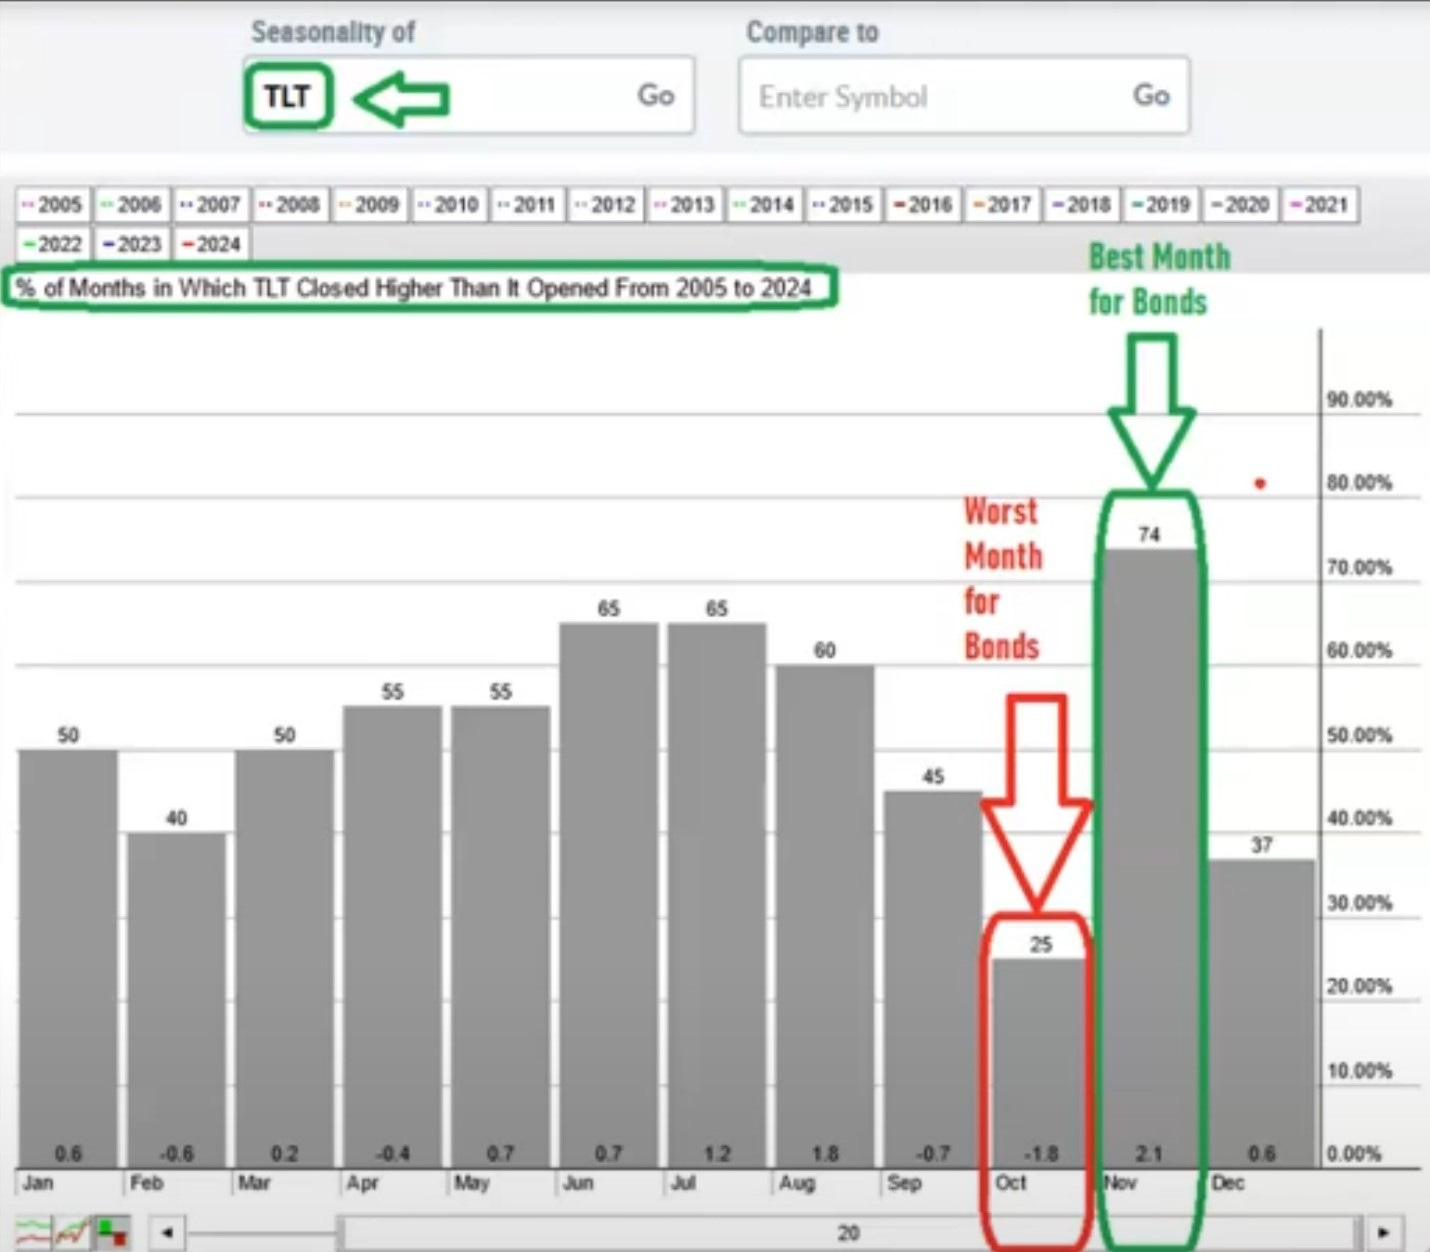
I would not view this countertrend rally in yields as a reason to panic. I would view it as a normal fluctuation of the market, the same thing it did in 1995. Historically, bonds worst month of the year is October, and their best month Is November.
As inflation is likely to run hot in the coming years, I am focused on purchasing strong companies at favorable prices, as these firms can weather economic storms and deliver substantial returns over time. Investing in hard assets can serve as a protective measure, but I firmly believe that high-quality companies will provide the growth and stability needed in the long term. Additionally, I plan to reintroduce Bitcoin into my investment strategy after a decade-long hiatus. My portfolio will feature a mix of hard assets, solid companies, Bitcoin, and a keen focus on undervalued opportunities beyond the big names.
As we enter the best 3 months of the year for trading, historically, I will be keeping an eye on both immediate risks and the enduring value of robust companies; I aim to navigate these challenges effectively. Ultimately, the earnings potential of well-managed companies will be a crucial driver of portfolio growth, allowing me to capitalize on opportunities even as I hedge against short-term uncertainties.
Great job Donald! Well written and I like the clarity