
Looking Forward: The Seasonality of November and December

As October fades into memory, it's time to embrace the seasonal trends of November and December. Investors often anticipate a "Christmas rally," and historical data supports this expectation, typically showing strong market performance during these months.
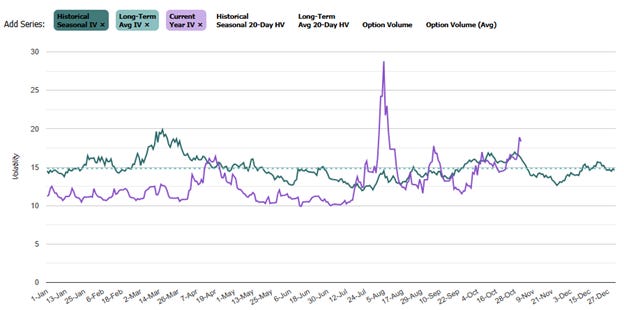
Historical Volatility Trends
Implied volatility (IV) generally peaks at the end of October but begins to decline through November. This year, however, due to the U.S. presidential election, IV has been higher than usual. The accompanying chart illustrates that current levels are above the historical norm, and I predict this trend will persist until the election results become clear. After the election, we should see a return to typical IV ranges..
Post-Election Considerations
High IV isn't solely driven by the election; post-election economic policies and inflation concerns also play significant roles. Inflation fears have led to rising gold prices and higher bond yields, prompting a protective stance against escalating costs. Interestingly, markets often bottom out when inflation fears peak, as illustrated below:
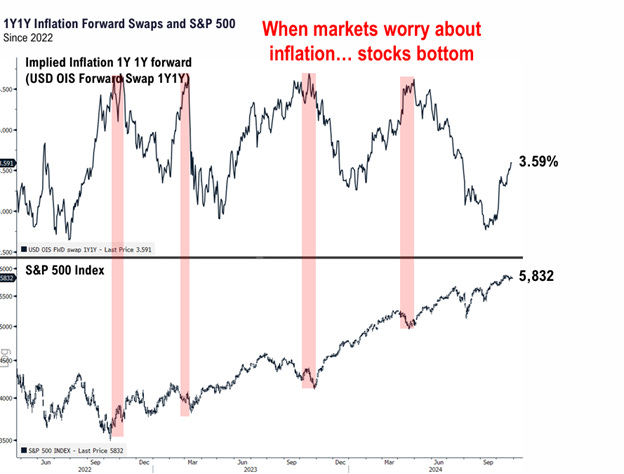
This context reinforces my previous SubStack discussion about how equities can serve as a robust hedge against inflation.
Market Performance Outlook for November and December
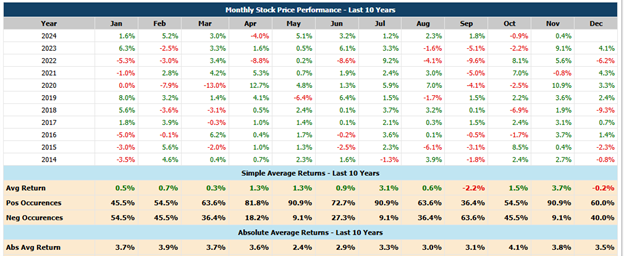
SPY has a 90% win rate in November with an average return of about 4%, dropping to 60% in December. See image below:
QQQ mirrors SPY's win rates but sees returns of 3.8% in November and a negative 1% in December.
IWM follows suit with 4.5% returns in November and about 1% in December.
XBI boasts an 82% win rate in November with a 6.5% average return, halving to 50% in December with a 1% return.
Most indices follow this seasonal pattern, with exceptions like XLE and XLU, which have about a 50%-win rate for both months.
Individual Stock Analysis
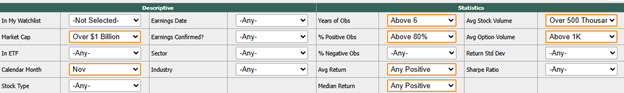
Using Market Chameleon, I scan for stocks with a 90% or higher frequency of positive returns in November as well as the other conditions in the image below:
I then organize them by frequency of returns and look for 90% or above. This means that at least 90% of the time we finish positive for the month of November on the individual stock. The image below is all the 100% positive observations:
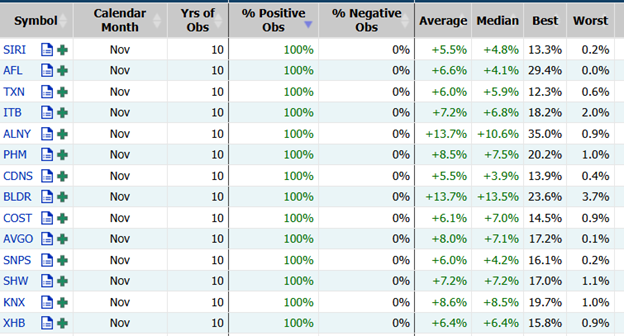
SHW: I told you I was buying this on October 7th due to its favorable November seasonality and its drop in price. The recent addition to the DJIA is boosting its performance.
BLDR, ITB, XHB, and DHI: Homebuilders typically see strong returns from November through April. My interest in DHI stems from its appeal to first-time buyers, anticipating a market surge if interest rates decrease.
Cautionary Note
Remember the case of BABA; expected movements can be delayed by macro-economic factors like rate cuts. If rates do not come down, I don’t think the homebuilders will follow their normal seasonality.
Additional Stock Picks:
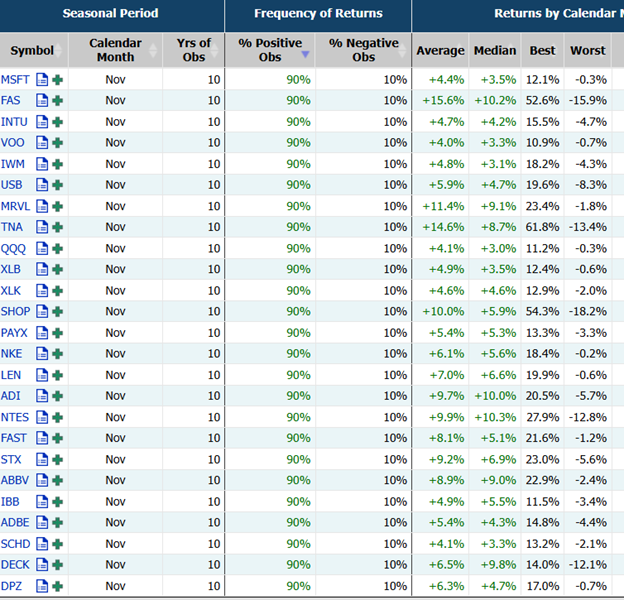
AVGO: Currently at a pivot point, either a failed breakdown or a significant drop could be buying opportunities. It also has an inside candle on the quarterly chart that has broken up. (If you don’t know what Inside candles mean please watch this training.) Inside Candle Training
CDNS: This offers 100% November returns, enhanced by recent earnings.
COST: This also shows 100% November positivity, with a potential TTM squeeze play on the weekly and daily chart. If you don’t know the TTM squeeze edge – here is a vide0. TTM Squeeze
FDX: With a Dragonfly Doji on its monthly chart, along with an inside candle and a 90% seasonal trend, it's on my radar for a potential breakout. There is also a significant gap above its breakout point, indicating strong potential.
MSFT: This stock should always be on your master watchlist, but it deserves special attention in November due to its 90% win rate and an average return of 4.5%.
DECK: A strong earnings report combined with ongoing consumer strength makes this stock worth watching. Its 90% positive rate in November and an average return of 6.5% mean I’ll be keeping a close eye on it.
FAST: This is a beautiful chart that may be forming the “little U” for a potential breakout.
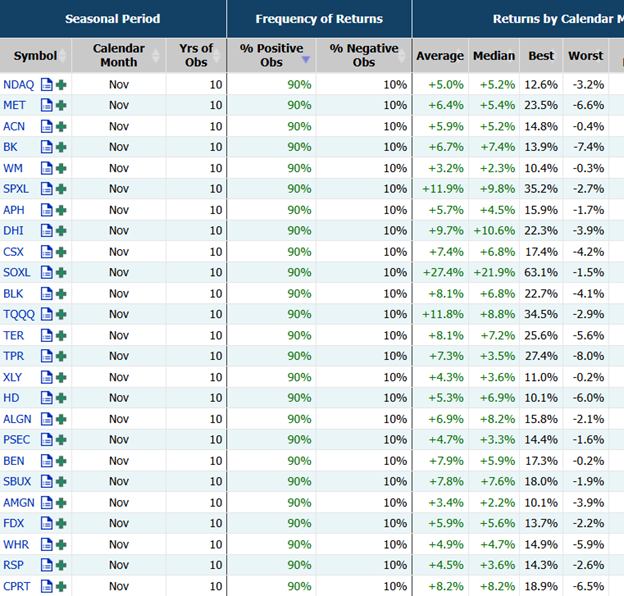
SMH: This exhibits strong November performance. I’m playing this through stocks like NVDA and AMD. The latter may take time to pay off—possibly a couple of earnings reports—but the former should yield quicker returns as we approach earnings.
ULTA: With a 90% win rate in November and being a recent purchase of Warren Buffett, I believe this stock is a good candidate for put spreads.
Investment Strategy
Given the anticipated strong performance in November and December, I plan to deploy a significant portion of my cash reserves; however, if the election results are delayed, expect volatility, which might delay investment moves. Regardless of the election outcome, I am optimistic about a year-end rally.
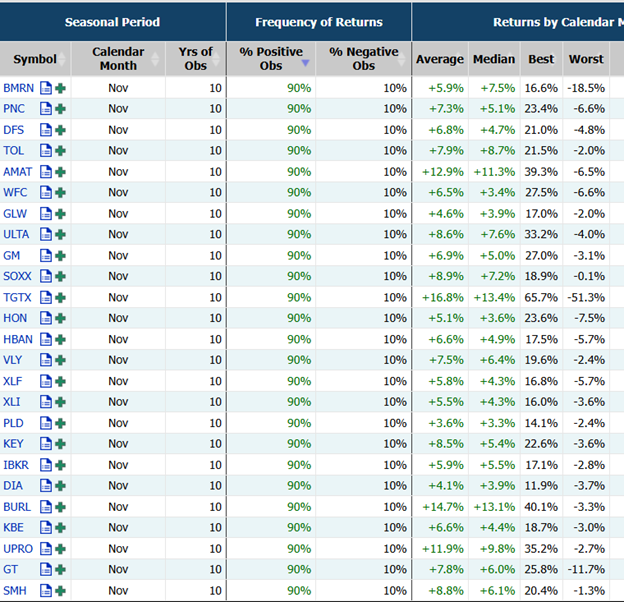
(Below are pictures of every stock that fit my earlier Market Chameleon search results:)
Yes of course - can you remind me? One of the main things I do that determines my covered calls or cash secured puts is the weight I have of said stock. Example I want 40k AMD but ill go up to 60 k. If I am holding 60K I will get much more aggressive on the short term covered calls. Vice Versa as well. When I am sitting at 20 K i will often times sell in the money puts hoping to get put the shares. See ya Monday
I really like COST at the level it was at Friday seems like a good risk reward and the pattern looks good. Hearing its seasonality makes me more confident in it