
MARKET POSITIONING ANALYSIS

May 2026 | BofA Global Fund Manager Survey + Sentiment Indicators
The Good, The Bad, and The Ugly
What follows is a systematic review of current institutional positioning data, sentiment extremes, and historical cycle patterns. The core message: the market has priced in perfection — soft landing, Fed pivot, and AI earnings growth simultaneously — while leverage, crowding, and seasonal headwinds are stacking against the near-term.
CHART 1 — Record Monthly Jump in FMS Equity Allocation
The BofA Global Fund Manager Survey recorded the single largest month-over-month increase in equity allocation in the history of the survey going back to 2001. In May 2026, net overweight equities jumped from +13% to +50%, a 37 percentage-point swing in a single month.
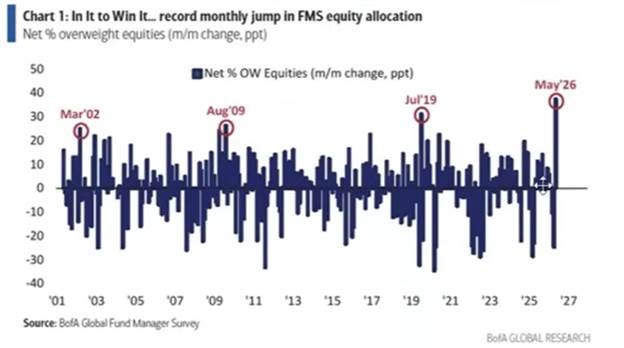
SIGNAL: The record allocation surge marks an institutional capitulation from underweight to maximum overweight. The wall of worry is gone.
In prior instances of extreme upside allocation spikes (Mar 2002, Aug 2009, Jul 2019), short-term momentum was real but marked proximity to major turning points. The Jul 2019 spike preceded a 6% Q4 pullback before the final leg higher.
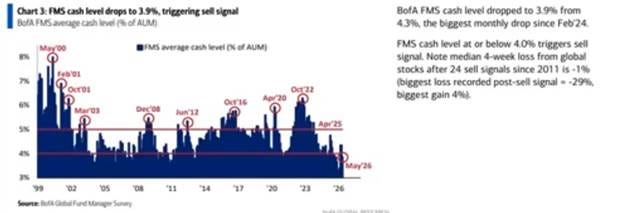
Simultaneously, BofA’s cash level indicator dropped from 4.3% to 3.9% triggering a formal “sell signal.” Cash at or below 4.0% has preceded a median 4-week loss of -1% across 24 prior signals since 2011, with the worst outcome being -29%.
CASH SIGNAL TRIGGERED: When institutional cash falls this low, the marginal buyer has already acted. The risk/reward for new long exposure compresses sharply.
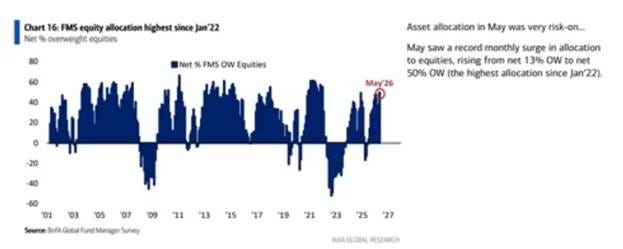
CHARTS 16 & 18 — Equity Allocation Highest Since Jan’22 + Cyclicals vs Defensives at 8-Year Extreme
Net FMS equity overweight at 50% is the highest absolute reading since January 2022, the peak of the post-COVID liquidity bubble. At that level, equities subsequently corrected -25% into October 2022.
The relative overweight of cyclicals (tech + industrials) versus defensives (healthcare + staples) is at its highest reading since January 2018. That setup preceded the February 2018 VIX spike. Institutional portfolios have effectively eliminated their defensive cushion.
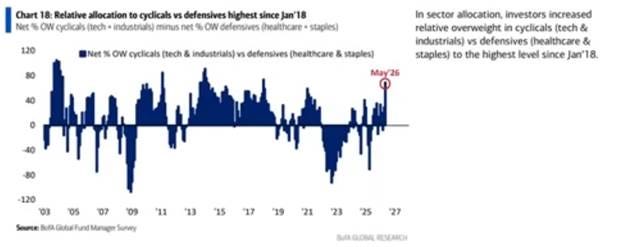
CROWDED SECTOR ROTATION: 73% of FMS respondents say “long global semiconductors” is the #1 most crowded trade — up from 24% just two months ago. The concentration risk is extreme.
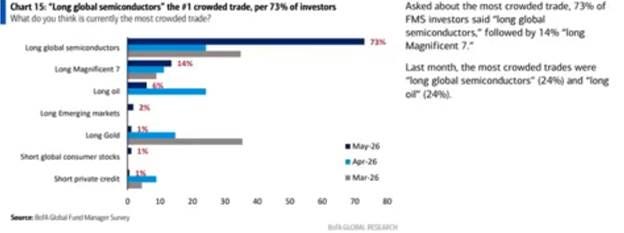
When everyone is already in the trade, the incremental catalyst needed to sustain the move has to keep getting larger. The semiconductor crowding data (bottom chart above) shows this went from a shared trade to a consensus in two months — a sign of late-cycle momentum chasing, not conviction-based accumulation.
BofA May Global Fund Manager Survey — Full Summary
The following page captures the complete BofA summary and introduces the gamma squeeze data — two datasets that together describe the mechanical underpinning of the May rally.