In times of market turbulence, when fear dominates and many investors are paralyzed by panic, opportunities abound for those who remain calm and strategic. Market corrections often create ideal conditions for disciplined investors to identify undervalued assets and position themselves for significant gains. While the bears may loudly proclaim doom, these moments frequently offer some of the best chances to seize opportunities and capitalize on rebounds. This article explores how to navigate such conditions effectively, focusing on key signals, strategic levels, and sectoral opportunities that can turn uncertainty into profit. For a more detailed understanding of how I approach these situations, please refer to my articles, “The Quant Savant” and “October Jitters or Hitters.”
While we recognize the need for stock picking because valuations are "frothy" in many areas, this doesn't mean the market is about to collapse. Let's examine some of the yellow flags that are popping up:
S&P 500 Advance-Decline Line: This has broken its trend line from October 2023, signaling potential weakness.
Yields: They've broken a downtrend line and are approaching a new high. If yields climb above and sustain at 5%, this could cause problems for equities. Personally, I believe we'll see a rejection at the 4.7-4.8% level.
Monthly Momentum: It appears to be peaking and starting to roll over. This doesn't mean we've hit the top, but it's worth noting and preparing for cautious moves forward.
The key question I ask myself is where we might see a bounce that allows us to take quick profits and then adjust our stops to protect against further declines if the bottom isn’t yet in.
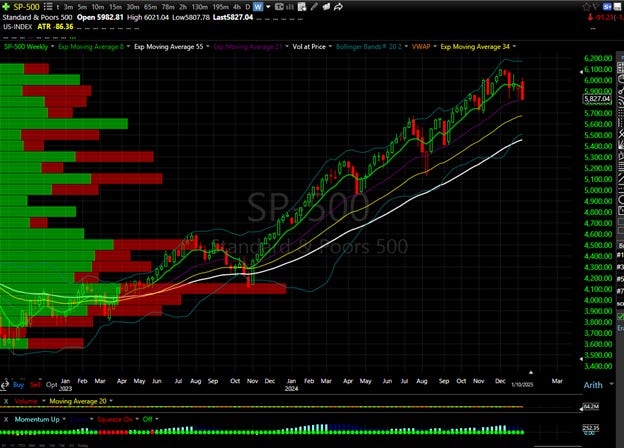
You can see from the chart above that there is a Fibonacci extension level (161.8%) at 5638.
If you look at the chart below you can see that we have held the previous dips to the weekly 34 exponential moving average(Yellow Line). The 34 EMA is 5672.54.
Using the Fibonacci retracement tool, you can see the larger pullback measures around 5600 and the small pullback around 5800.
I believe we'll hit these levels, coinciding with the weekly quadrant balance momentum finding a bottom as they reach oversold levels.
When zooming into the Volume Profile (VP) from September through early November, the zone for a potential bounce is between 568 and 572, with a gap close at 576.
Based on this data, a bounce seems likely around 5700, give or take a few points. I’m willing to attempt the gap close, but if it doesn’t bounce, I’ll cut my losses quickly. My "magic wand" scenario comes into play at the 570-572 level. I plan to begin absorbing there, with buy orders set at 572, 570, and 568
My focus this year is to uncover opportunities beneath the surface, not just in the indices. However, when the indices offer a clear opportunity, we should take it. I think a 5-6% pullback from the highs is an excellent opportunity as we head into earnings season and the inauguration.
My base case for the S&P 500 is a gain of 9-14% this year. If we see a 6% pullback, we could potentially achieve a 15-20% gain by buying into this dip. Historically, after a 20% gain, the average return for the S&P 500 is 10.6%.
If we can catch this bounce correctly, it could set up an entry position to hold for months or even the entire year. Remember, earnings drive the markets, and the real gems this year will likely come from undervalued sectors such as healthcare, industrials, and materials. I’ll have my earnings sheet updated this week and will share the link soon.
In conclusion, while market corrections might scare many into bearish predictions, strategic opportunities abound. By focusing on undervalued sectors and preparing for potential bounces, particularly around the 5700 level, investors can capitalize on these pullbacks. With a prudent approach to earnings and market trends, we might just exceed our base case for the S&P 500 this year.


Thanks for this detailed analysis Dman. I cannot thank you enough for teaching us how you invest. I hope and pray that you and your family are staying safe out there in California.